
Wikimedia Commons
Graphs
Graphs
Graphs show information in a way that is easy to see. They turn numbers into pictures. A graph can show how many kids like pizza or how hot it is each day. Graphs help people compare things quickly. Scientists, teachers, and kids all use graphs.
Kinds of Graphs
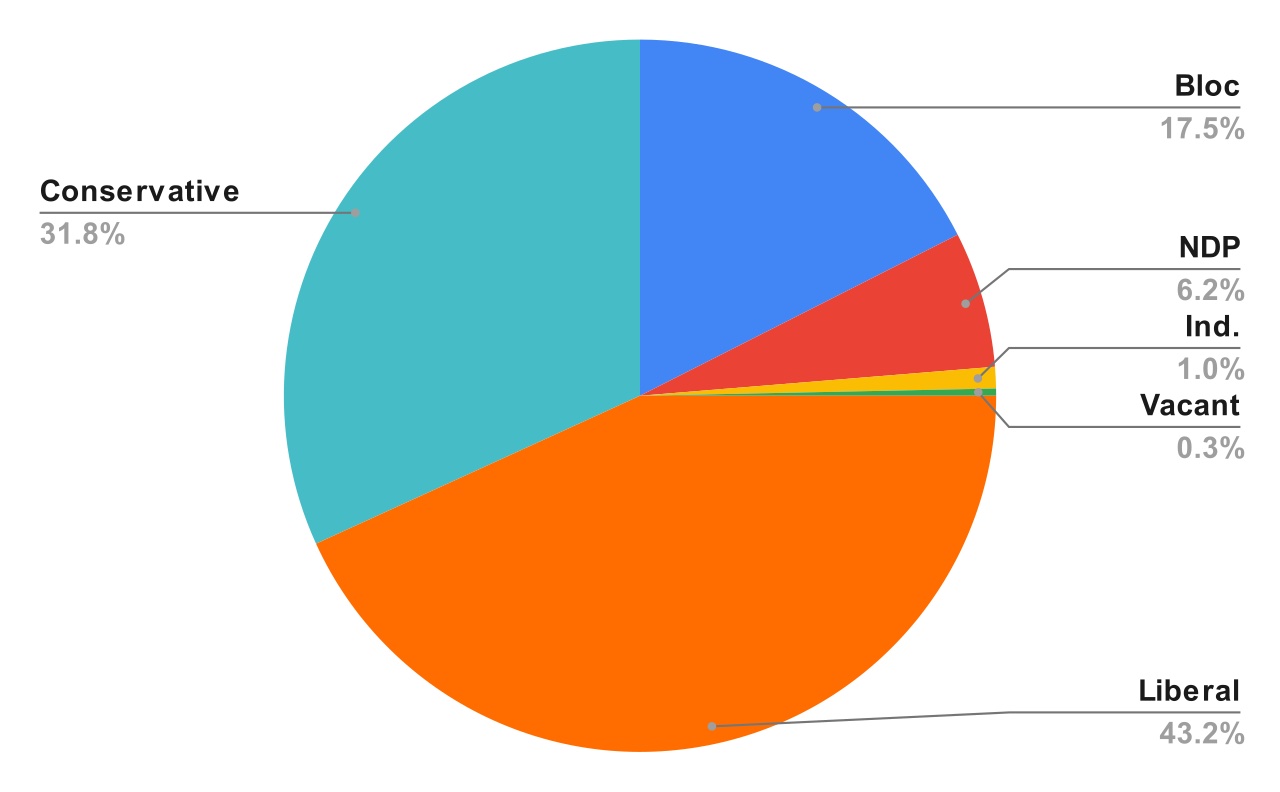
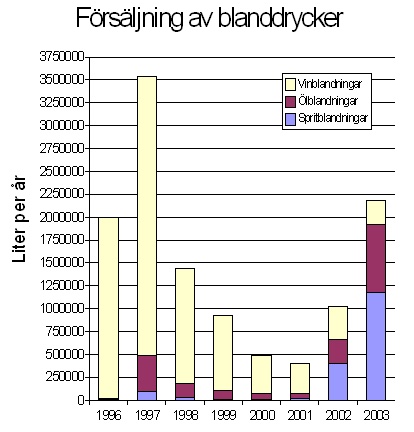
There are many kinds of graphs. A bar graph uses tall or short bars to show amounts. A line graph uses lines to show how something changes over time. A pie chart looks like a pizza cut into slices. Each slice shows part of a whole.
Reading Graphs
Every graph has a title that tells you what it is about. Labels show what each part means. Numbers on the side help you see how much of something there is. Once you know how to read a graph, you can find answers fast. Graphs turn lots of information into a simple picture.
Fun Facts
- The first bar graph was drawn over 200 years ago by William Playfair.
- Weather reports use graphs to show temperatures and rain.
- A pictograph uses small pictures to stand for numbers.
Did You Know?
A pie chart got its name because it looks like a round pie cut into slices.

You finished the article! Great job!