
Wikimedia Commons
Line Graphs
Line Graphs
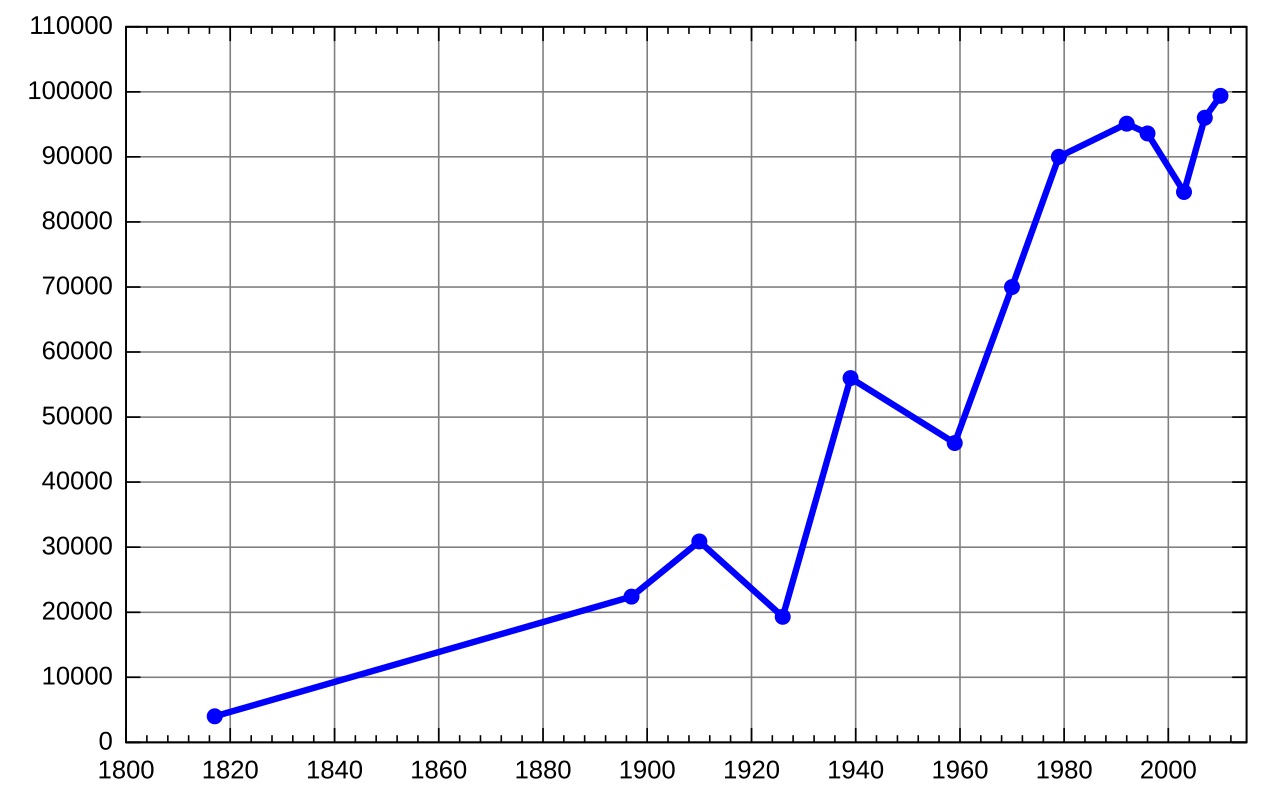
A line graph shows changes over time. It uses dots for data and a line to connect them. The line goes up when numbers grow and down when numbers drop. Line graphs are great for tracking things like weather or growth. They make it easy to spot trends.
Parts of a Line Graph
A line graph has a title and two axes. The bottom axis usually shows time, like days or months. The side axis shows the amount being measured. Each dot marks a value at a certain time. When the dots are joined, the line shows how things changed.
Where Line Graphs Help
Weather people use line graphs to show temperature over a week. Doctors use them to track a patient's health. Teachers use them to show how students are improving. Stores use them to see how sales go up and down. Line graphs are perfect whenever you want to see changes clearly.
Fun Facts
- Line graphs can have more than one line to compare two things.
- William Playfair also invented the line graph in the 1780s.
- A line that goes flat means nothing changed.
Did You Know?
Line graphs are used to show how Earth's temperature has changed over many years. This helps scientists study our planet.

You finished the article! Great job!