
Wikimedia Commons
Pie Charts
Pie Charts
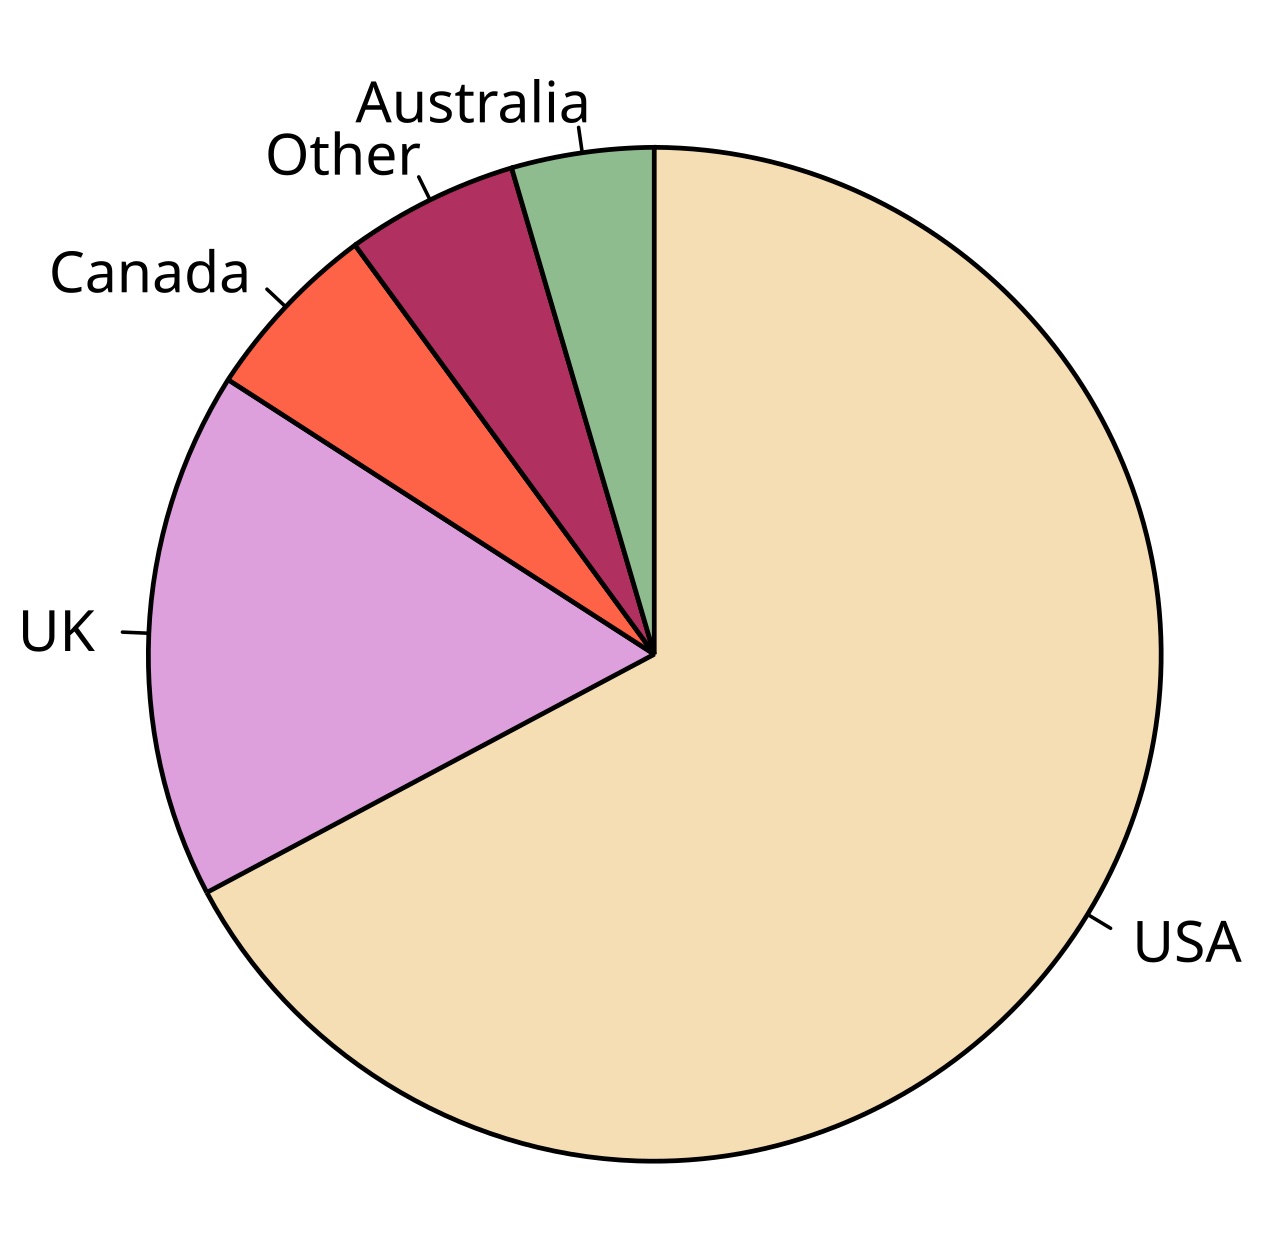
A pie chart is a special kind of picture graph. It is shaped like a circle and looks just like a pie cut into slices. Each slice shows a part of the whole group. Bigger slices mean bigger parts, and smaller slices mean smaller parts.
How Pie Charts Work
A pie chart uses a full circle to show all of something. The circle is cut into pieces called slices or sectors. Each slice stands for one part of the data. If half the kids in class like pizza, then half the pie chart will show pizza. The slices always add up to the whole circle.
When to Use Them
Pie charts are great for showing how things compare. You might use one to show favorite colors in your class. They help you see the biggest and smallest groups fast. News shows and school books often use pie charts. They make numbers easy to understand with just one look.
Fun Facts
- The first pie chart was made in 1801 by a man named William Playfair.
- Pie charts are sometimes called circle graphs.
- In France, pie charts are called 'camembert' after a round cheese.
Did You Know?
A pie chart always adds up to 100 percent because it shows the whole of something.

You finished the article! Great job!